Building a Production-Grade AI Gateway with LiteLLM on AWS
Building a Production-Grade AI Gateway with LiteLLM on AWS
The Problem
I was working with multiple LLM providers — Anthropic, OpenAI, Google — and the integration pain was growing fast. Each provider has its own API format, its own SDK, its own error handling. Every time I wanted to switch models or add a new provider, I had to touch application code. Worse, when a provider went down, my application went down with it. There was no failover, no cost visibility, no central control.
I needed a single gateway that sits between my applications and all LLM providers — something that handles routing, failover, caching, and monitoring in one place. That's what led me to build a self-hosted AI Gateway using LiteLLM on AWS.
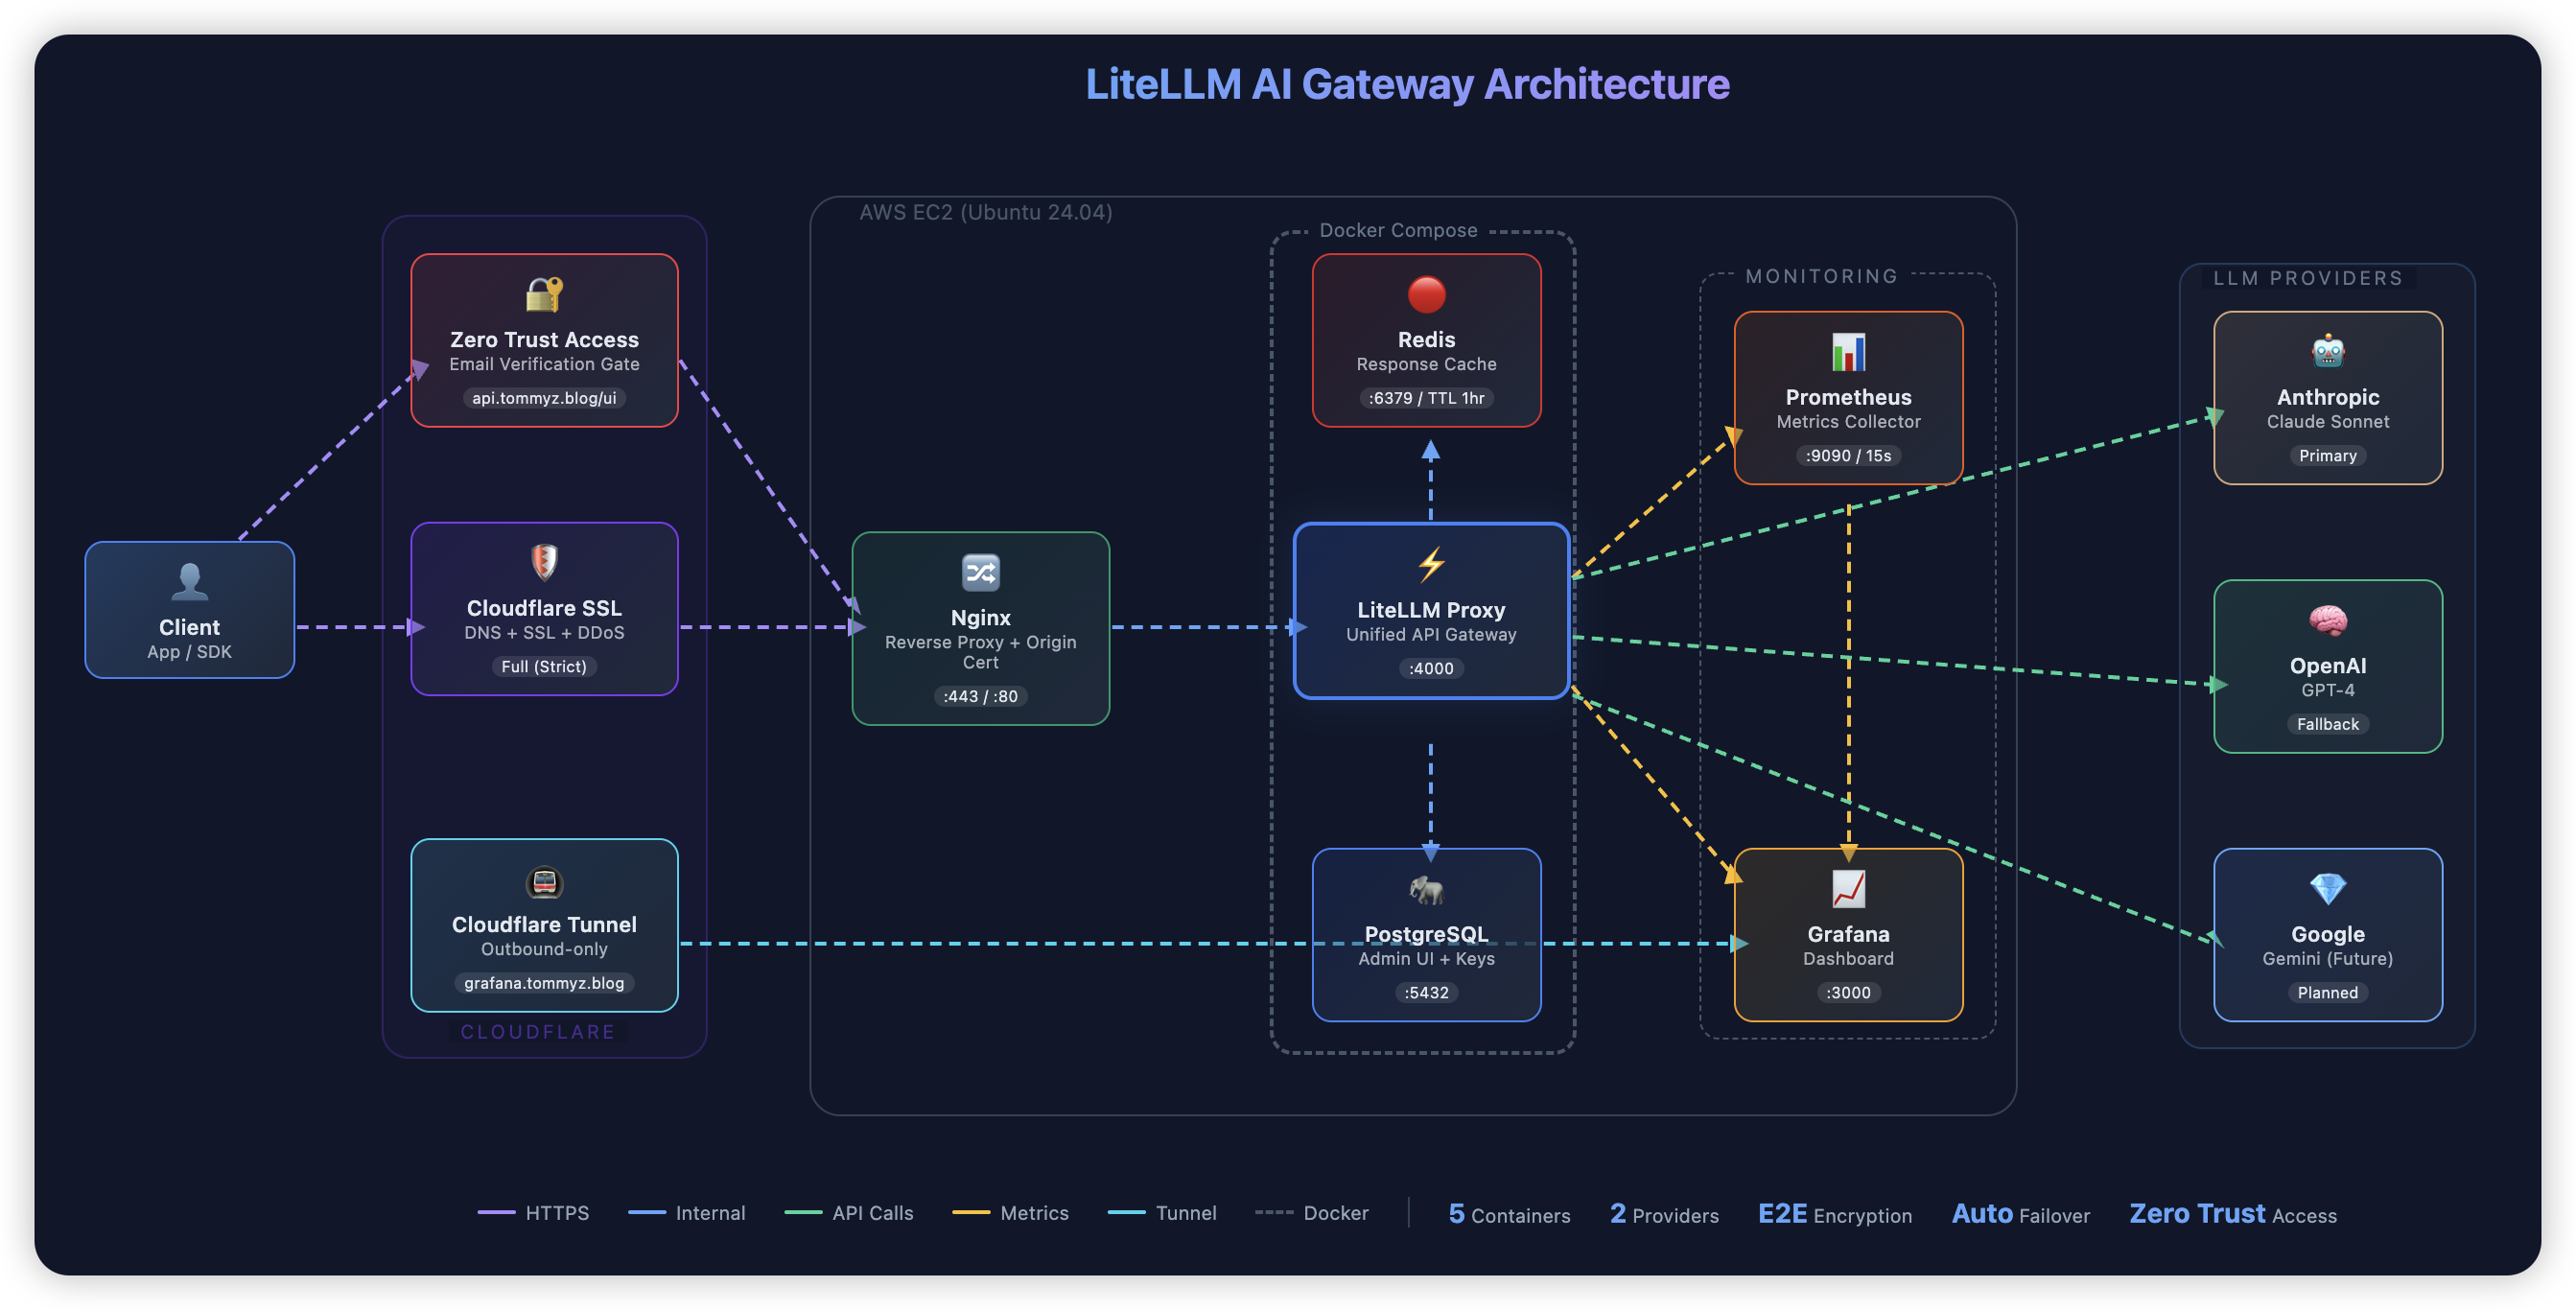
The Architecture
The gateway runs on a single AWS EC2 instance with 5 Docker containers orchestrated by Docker Compose:
Client Request
      |
  Cloudflare (DNS + SSL + Zero Trust)
      |
  Nginx (Reverse Proxy)
      |
  LiteLLM Proxy
      |
  ┌───┴───────────────────────┐
  |           |               |
Redis    PostgreSQL    Prometheus
(Cache)  (Admin DB)   (Metrics)
                          |
                       Grafana ← Cloudflare Tunnel
                     (Dashboard)
Every request flows through Cloudflare for DDoS protection and SSL, hits Nginx for reverse proxying with Origin Certificate verification, then reaches LiteLLM which routes it to the right LLM provider. Redis caches repeated calls, PostgreSQL stores admin data and usage tracking, and Prometheus feeds metrics into a Grafana dashboard.
Problems Solved
Provider Lock-in and API Fragmentation
LiteLLM exposes a single OpenAI-compatible endpoint for all providers. My applications don't know or care whether they're hitting Claude, GPT-4, or Gemini — they all go through the same API. Switching providers or adding new models is a config change, not a code change.
Downtime from Provider Outages
I configured a circuit breaker pattern with automatic failover. When a provider fails 3 consecutive times, it enters a 30-second cooldown and traffic routes to the next available provider automatically. Provider outages became invisible switchovers — no application changes, no downtime.
Uncontrolled API Costs
Two things helped here. First, Redis caching with a configurable TTL eliminates redundant API calls — identical prompts return cached responses instantly at zero cost. Second, LiteLLM's Virtual Keys give each user or application its own API key with individual budget limits and spend tracking. I can see exactly who's spending what.
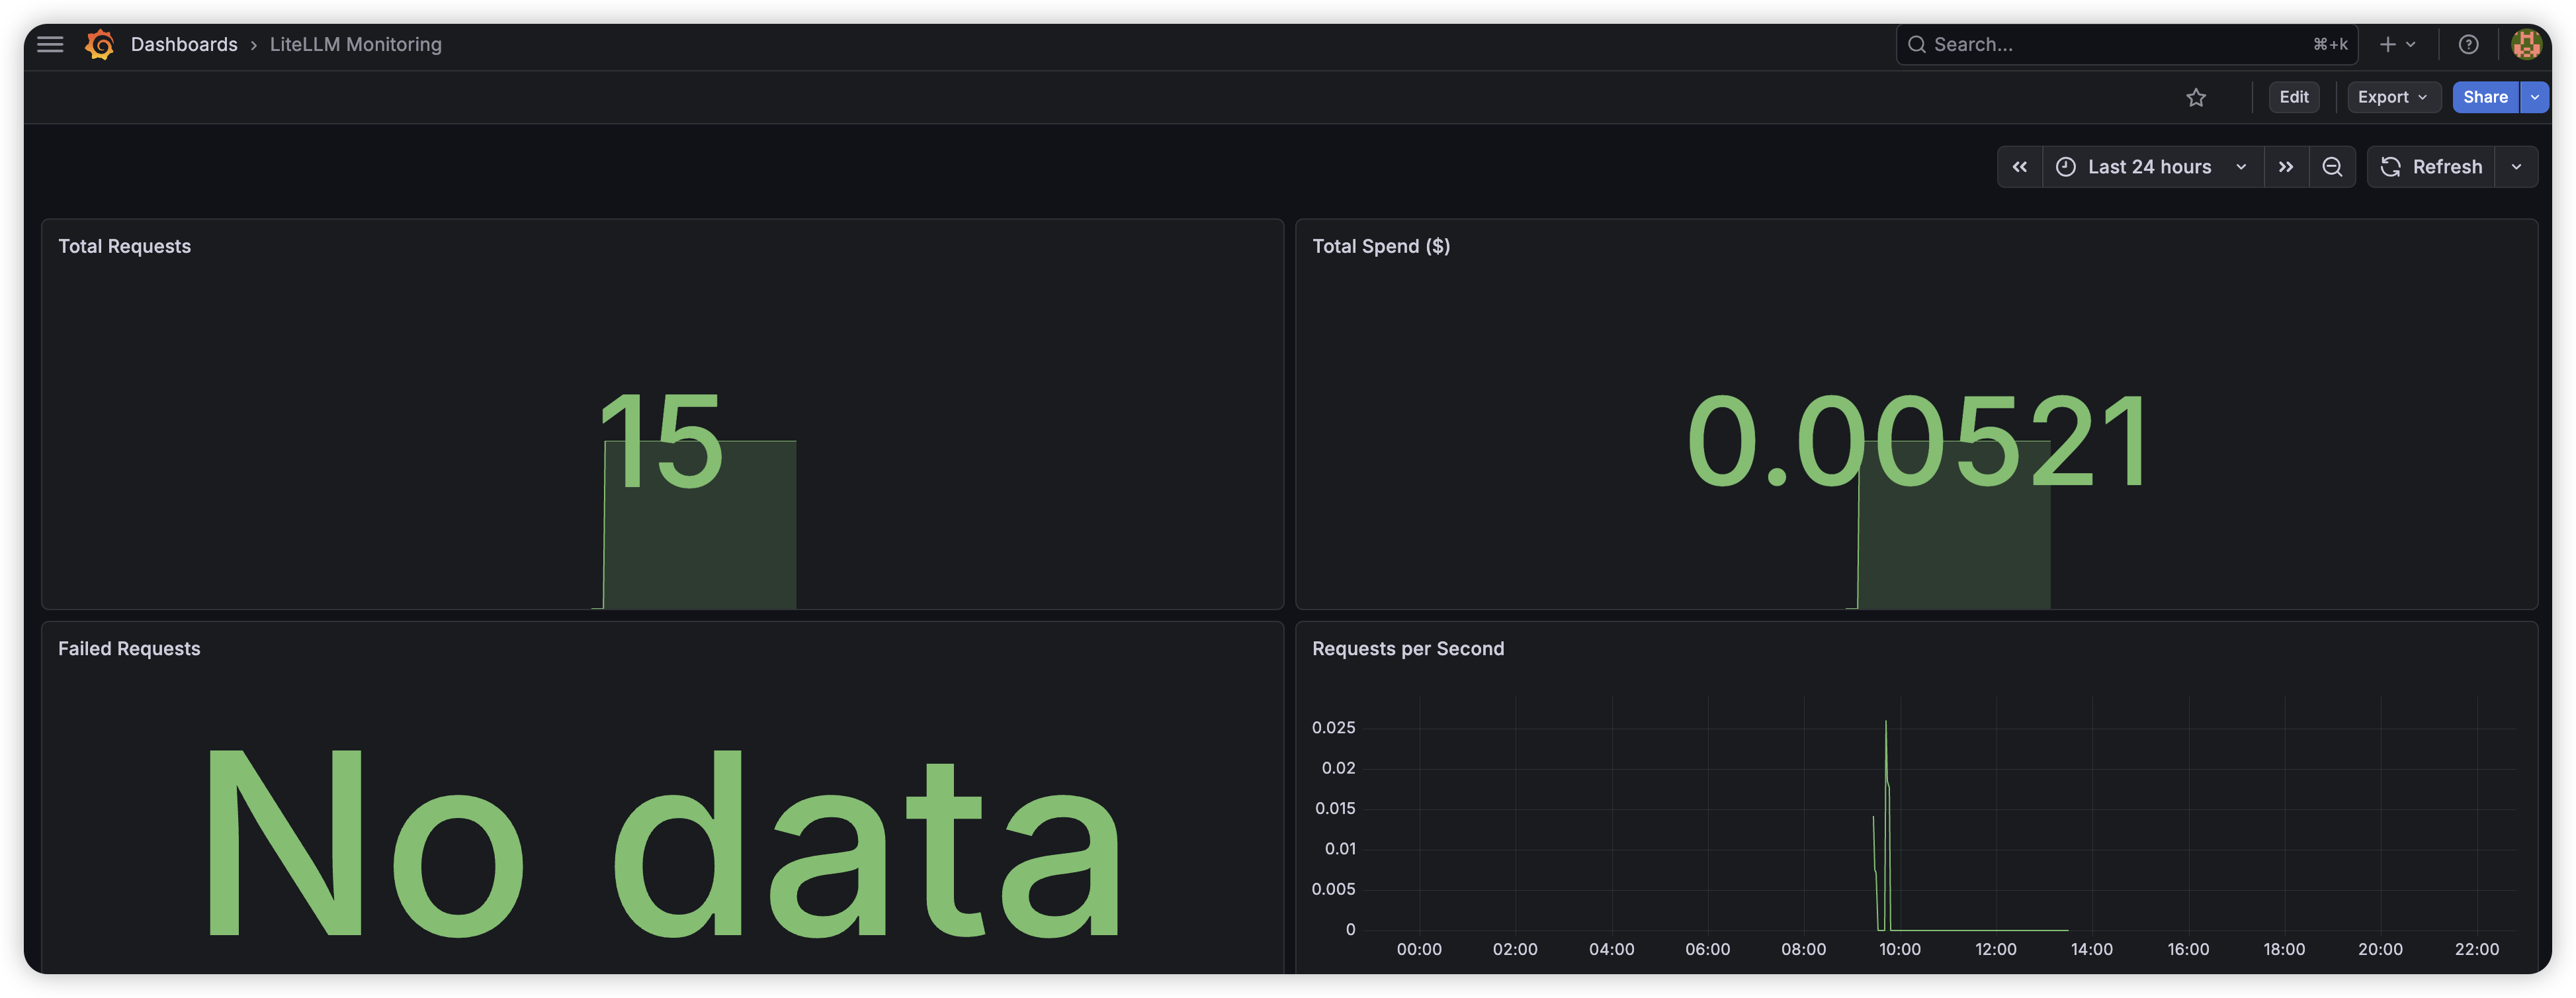
No Observability
I built a Grafana dashboard pulling Prometheus metrics from LiteLLM — total requests, spend, error rates, latency, and request throughput over time. Everything is visible in real-time instead of waiting for a monthly invoice to understand usage patterns.
Exposed Infrastructure
The initial deployment had Grafana, Prometheus, and LiteLLM ports all open to the public internet. I locked it down to only 3 ports (22, 80, 443) through AWS Security Groups, put Nginx in front of LiteLLM with Cloudflare Origin Certificates for end-to-end encryption, and set up Cloudflare Tunnel with Zero Trust Access for Grafana — outbound-only connection, email-verified access, no inbound ports exposed.
The admin interfaces now sit behind two authentication layers: Cloudflare Access email verification first, then the service's own login. Even a leaked password is useless without access to my email.

Security Layers
| Layer | Protection | | ------------------ | ---------------------------------------------- | | Cloudflare | DDoS protection, hides real IP, SSL encryption | | Cloudflare Access | Email-based verification for admin UIs | | Cloudflare Tunnel | No inbound ports needed for Grafana | | Nginx | Origin Certificate, reverse proxy | | AWS Security Group | Only ports 22, 80, 443 open | | Master Key | API authentication | | Virtual Keys | Per-user access control with budgets |
Results
- Unified API across Anthropic and OpenAI with zero application-side changes
- Automatic failover between providers — no downtime during outages
- Cost reduction through Redis caching of repeated prompts
- Per-user budget control and spend visibility via Virtual Keys
- Real-time monitoring with Grafana dashboards
- End-to-end encryption with 7 security layers
- Only 3 ports exposed to the internet
- Total infrastructure cost: ~$10/month
Tech Stack
Gateway: LiteLLM, FastAPI, Python
Data: Redis (caching), PostgreSQL (admin/usage)
Infrastructure: Docker, AWS EC2, Nginx
Security: Cloudflare (DNS/SSL), Cloudflare Tunnel, Cloudflare Zero Trust Access
Monitoring: Prometheus, Grafana
Share this article
Related Articles

GitHub Trending Weekly Digest — July 6-11, 2026
A curated weekly roundup of the hottest GitHub repositories. Deduplicated and ranked by trending persistence. This week's focus: AI agent engineering maturity, production-grade tooling, and design-to-code automation.
GitHub Trending Weekly Digest — June 29 – July 2, 2026
A curated weekly roundup of the hottest GitHub repositories. Deduplicated and ranked by trending persistence.
GitHub Trending Weekly Digest — Jun 22-27, 2026
A curated weekly roundup of the hottest GitHub repositories. Deduplicated and ranked by trending persistence.